The Snodon Standard • Q2 2026

The Snodon Standard

Stable Market. Changing County.

Barrow County's residential market remained broadly stable during Q2 2026, even as inventory, construction, infrastructure investment, reassessment growth, and development pressure continued changing the county around it.

Reporting period: April 1-June 30, 2026 • Geography: Barrow County by physical property location • Six-page report

Page 1 • Quarter at a Glance

Stable Market. Changing County.

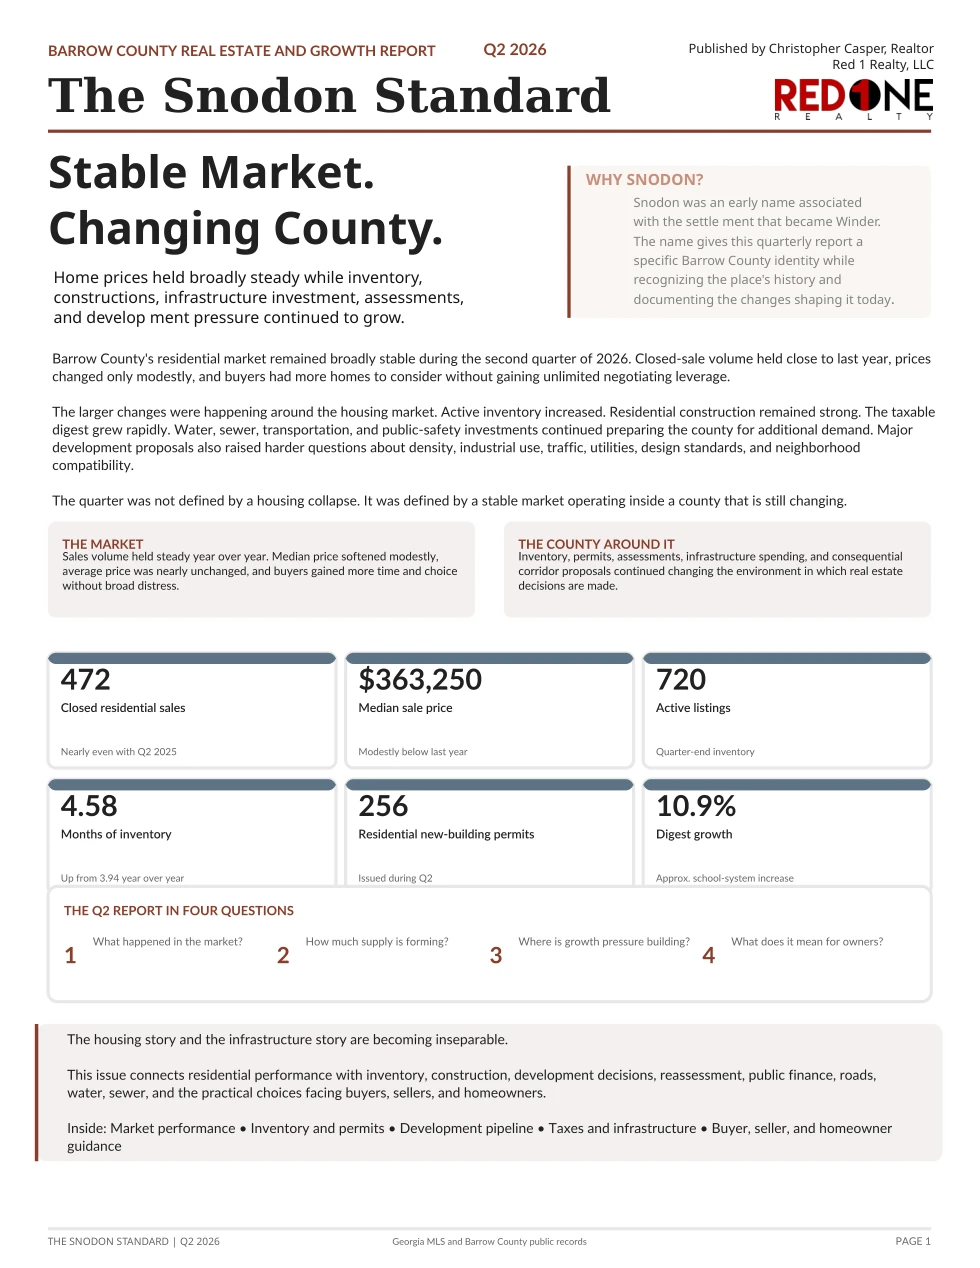
The first page establishes the quarter's central interpretation: residential market stability existed alongside rising inventory, active construction, tax-base growth, infrastructure investment, and development pressure.

Cover of The Snodon Standard Q2 2026, the Barrow County Real Estate and Growth Report published by Christopher Casper, Realtor, Red 1 Realty LLC.
Original Page 1 from the approved six-page publication. Open the complete PDF for the full print-form report.

Quarter at a Glance

Barrow County recorded 472 residential sales during Q2 2026, nearly matching the 470 sales recorded one year earlier. The median sale price was $363,250, modestly below Q2 2025, while average sale price remained almost unchanged. Quarter-end inventory reached 720 active listings, producing 4.58 months of inventory.

Beyond the resale market, the county issued 256 residential new-building permits, and the school-system net taxable digest increased approximately 10.9%. Together, these figures describe a market that remained active and generally stable while the larger county environment continued evolving.

472Closed residential sales
$363,250Median sale price
720Quarter-end active listings
4.58Months of inventory
256Residential new-building permits
10.9%Approximate school-system taxable-digest growth

What the numbers show

  • Closed-sale volume held essentially even year over year.
  • Prices moved modestly rather than showing broad distress.
  • Buyers had more homes available than one year earlier.
  • Residential construction remained active beyond visible MLS inventory.

What this means for buyers

Countywide conditions provided more alternatives than one year earlier, but buyers still needed property-specific comparisons. More inventory did not mean every seller lacked leverage.

What this means for sellers and homeowners

Sellers faced more competition, especially from new construction. Homeowners also needed to watch the public decisions occurring around their property, not only sale prices.

What this means for local growth

Permit activity, infrastructure proposals, budget growth, and zoning cases all pointed to continued pressure on major corridors and public systems.

Important cautions

  • 256 means residential new-building permits, not completed homes.
  • A 10.9% digest increase does not mean every property rose 10.9%.
  • Countywide statistics do not describe every neighborhood equally.

Sources: Georgia MLS for residential market facts; Barrow County Tyler EnerGov permit records; Barrow County tax and millage materials; approved Barrow County public records for infrastructure and development context.

Page 2 • Residential Market Performance

More Choice, Not a Market Collapse

Page 2 explains where sales concentrated, how purchases were financed, and why new construction remained a major competitive force.

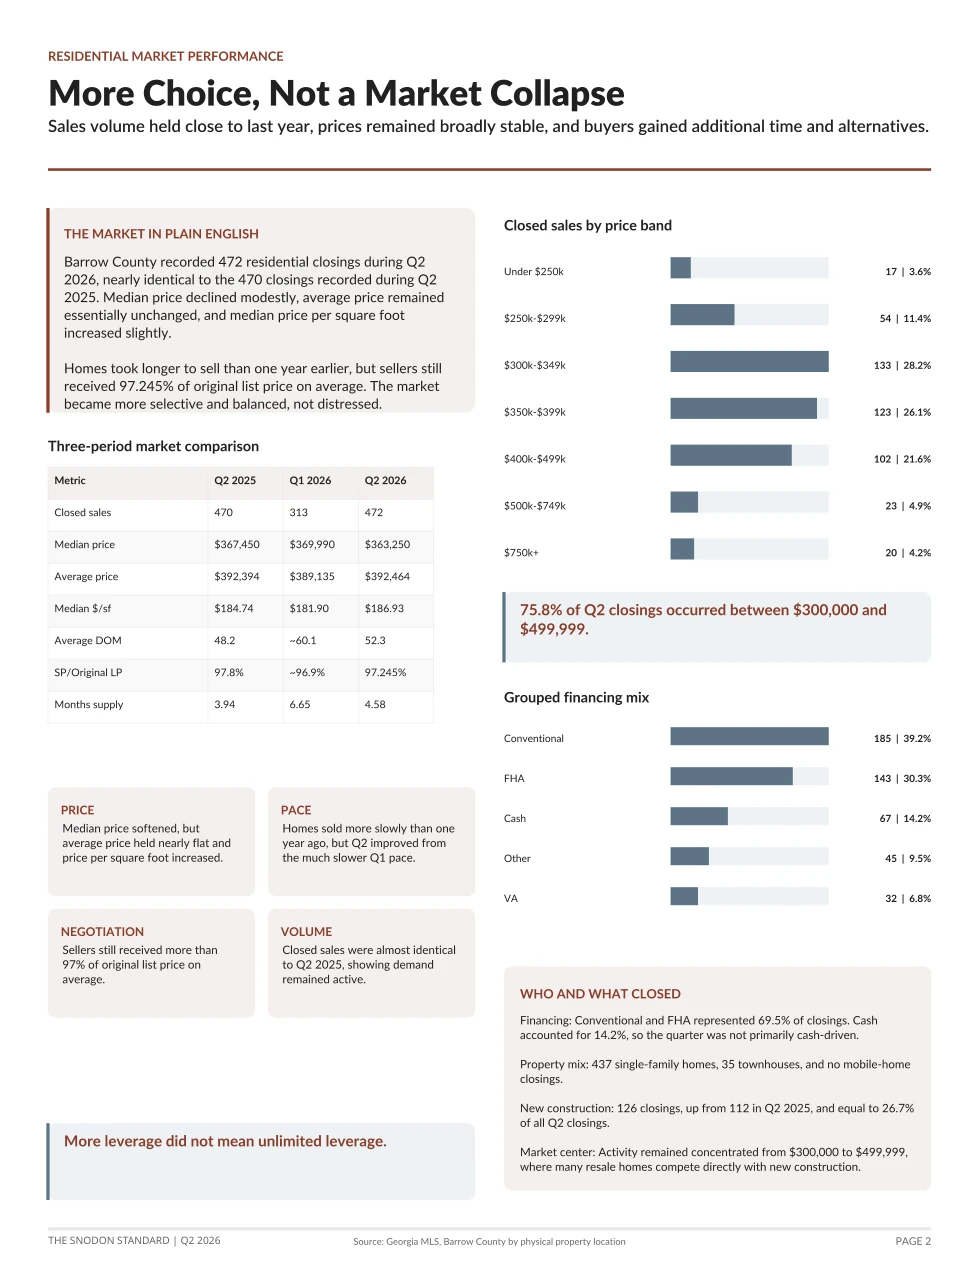
Page 2 of The Snodon Standard Q2 2026, covering residential market performance.
Original Page 2 from the approved publication.

Closed Sales and Buyer Mix

Q2 2026 produced 472 closed residential sales, almost identical to the 470 closings recorded during Q2 2025. Approximately 75.8% of all sales occurred between $300,000 and $499,999.

Conventional and FHA financing together represented 69.5% of closings, while cash accounted for 14.2%. New construction represented 126 closings, or 26.7% of the quarter’s market.

75.8% of Q2 closings occurred between $300,000 and $499,999.
Price bandSalesShare
Under $250,000173.6%
$250,000-$299,9995411.4%
$300,000-$349,99913328.2%
$350,000-$399,99912326.1%
$400,000-$499,99910221.6%
$500,000-$749,999234.9%
$750,000 and above204.2%
FinancingSalesShare
Conventional, including 95% and 90% variants18539.2%
FHA14330.3%
Cash6714.2%
VA326.8%
Other financing459.5%

What the numbers show

  • The market’s center of gravity was $300,000-$499,999.
  • Mortgage-financed buyers drove most transactions.
  • FHA remained a major source of buyer participation.
  • New construction represented more than one in four closings.

What this means for buyers

Buyers frequently compared resale homes against builder incentives, financing offers, and new-construction alternatives. List price alone did not always reveal the full cost difference.

What this means for sellers

A resale listing in the market’s most active price bands also entered its most competitive segment. Pricing, condition, concessions, and nearby builder activity mattered.

Important cautions

  • Financing type does not identify first-time buyers or investors.
  • Price bands describe distribution, not affordability relative to income.
  • New-construction closings are MLS-recorded sales.

Source: Georgia MLS. Financing categories use the approved grouped presentation and reconcile to 472 closings. No FMLS totals are incorporated into the published Q2 results.

Page 3 • Inventory and Market Flow

Supply Is Growing in More Than One Place

Page 3 separates current MLS inventory from pending activity, closed sales, permit activity, and the future construction pipeline.

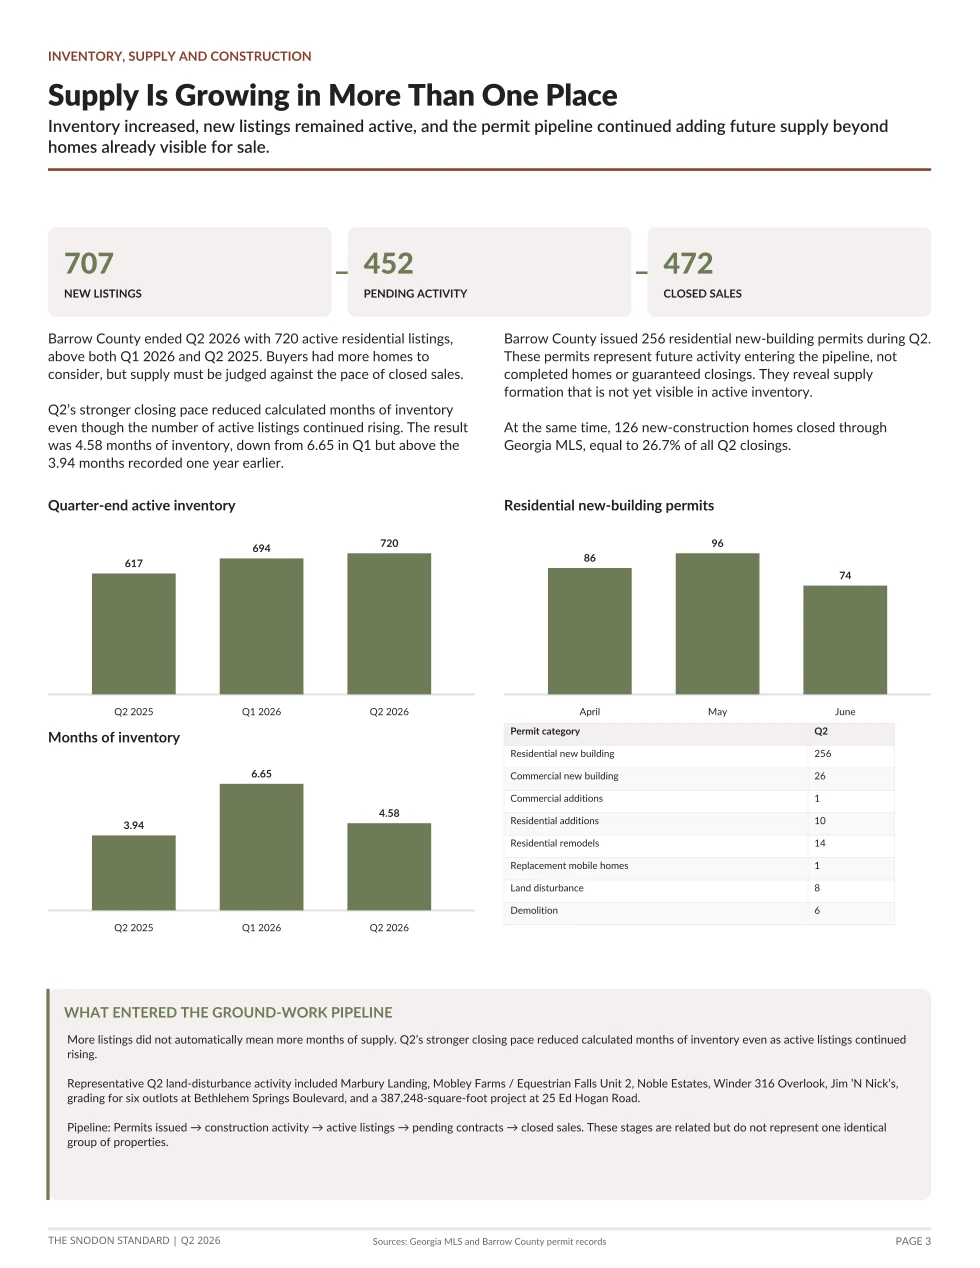
Page 3 of The Snodon Standard Q2 2026, covering inventory, market flow, permits, and future supply.
Original Page 3 from the approved publication.

Inventory and Market Flow

Barrow County recorded 707 new listings, 452 pending transactions, and 472 closed sales during Q2 2026. Quarter-end active inventory reached 720 homes, above both Q1 2026 and Q2 2025.

Calculated months of inventory was 4.58, down from 6.65 in Q1 because Q2’s stronger closing pace absorbed available inventory more quickly, even while the active count continued rising.

707New listings
452Pending activity
472Closed sales
720Quarter-end active inventory
Current inventory shows what buyers could see during the quarter. Permit activity shows part of the future supply pipeline.

Months of inventory

  • Q2 2025: 3.94
  • Q1 2026: 6.65
  • Q2 2026: 4.58

Months of inventory depends on both active supply and the recent closing pace.

Residential permits by month

  • April: 86
  • May: 96
  • June: 74
  • Q2 total: 256
Permit categoryCount
Residential new building256
Commercial new building26
Commercial additions1
Residential additions10
Residential remodels14
Replacement mobile homes1
Land disturbance8
Demolition6

What this means for buyers

Buyers had more visible inventory than one year earlier, but future supply was not necessarily ready for occupancy. A permit should not be treated as an available home.

What this means for sellers

More active inventory increased competition. Resale sellers also faced supply that could emerge later through current building activity.

What this means for local growth

Residential, commercial, and land-disturbance records show development pressure appearing across multiple project types and locations.

Important cautions

  • Listings, pendings, permits, and closings describe different stages.
  • A permit does not establish that construction started or finished.
  • Quarter-end inventory is a point-in-time figure.
  • Months of inventory is an indicator, not a forecast.

Sources: Georgia MLS for listings, pending activity, active inventory, and closings; Barrow County Tyler EnerGov for permit counts and approved project descriptions.

Page 4 • Growth and Development

Growth Is Arriving at Two Different Scales

Page 4 separates incremental property changes from larger corridor proposals and preserves the difference between staff recommendations, Planning Commission actions, and final BOC decisions.

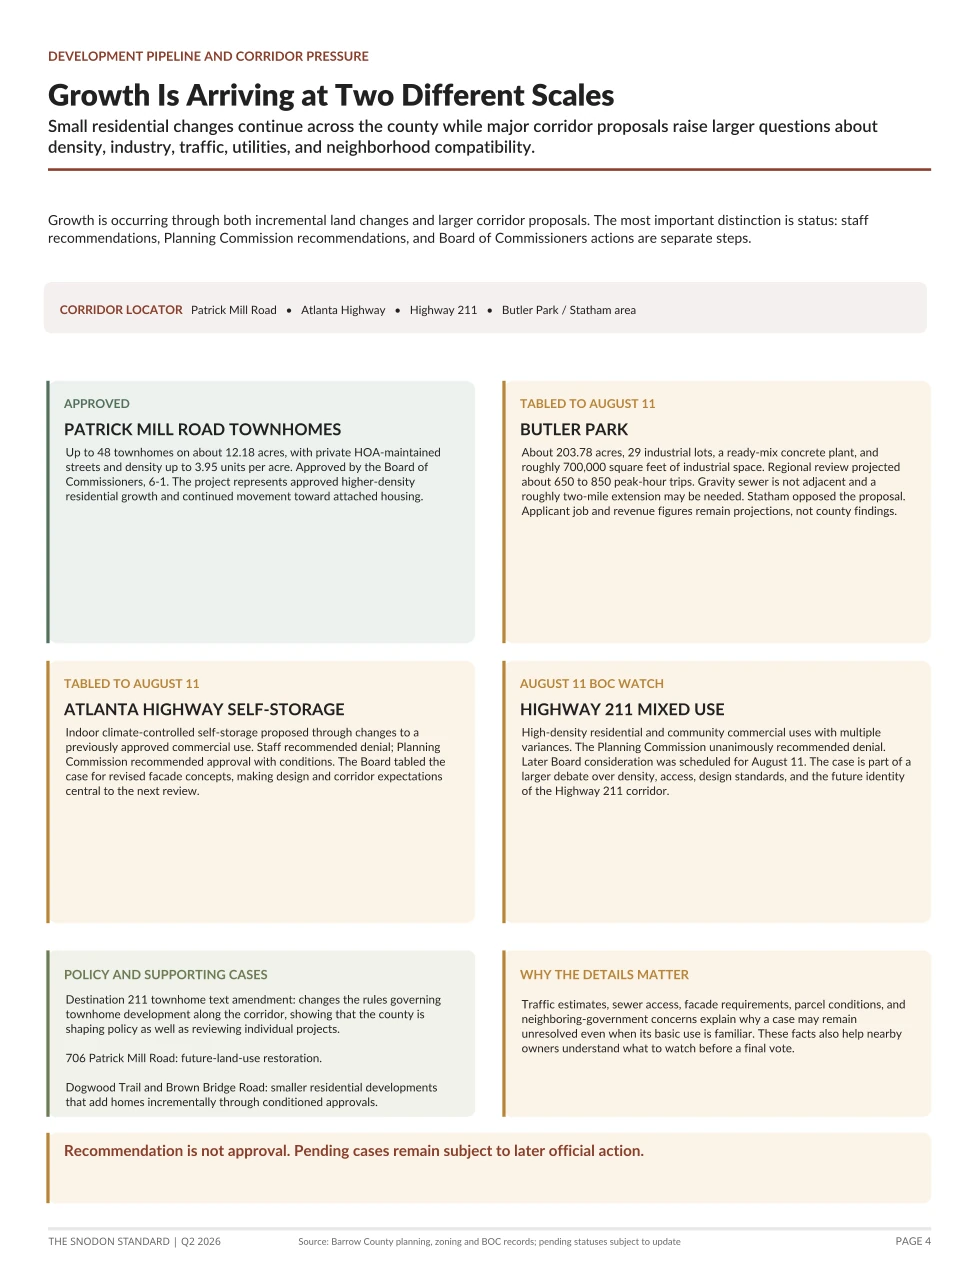
Page 4 of The Snodon Standard Q2 2026, covering growth, development, and planning cases.
Original Page 4 from the approved publication.

Growth and Development

Barrow County’s development pipeline showed two forms of growth. Smaller lot splits, boundary adjustments, agricultural rezonings, and modest subdivisions continued adding homes incrementally.

At the same time, larger projects along Patrick Mill Road, Atlanta Highway, Highway 211, and near Statham raised broader questions about density, industrial use, truck traffic, sewer availability, road capacity, facade standards, and corridor identity.

Approved

Patrick Mill Road townhomes

  • Up to 48 townhomes
  • Approximately 12.18 acres
  • Up to 3.95 units per acre
  • Private HOA-maintained streets
  • BOC vote: 6-1

Tabled to August 11

Butler Park

  • Approximately 203.78 acres
  • 29 industrial lots
  • Approximately 700,000 square feet
  • Ready-mix concrete plant proposed
  • Applicant job and revenue figures remain projections

Tabled to August 11

Atlanta Highway self-storage

  • Indoor climate-controlled storage
  • Staff recommended denial
  • Planning Commission recommended approval with conditions
  • BOC requested revised facade concepts

Pending BOC action

Highway 211 mixed use

  • High-density residential and community commercial uses proposed
  • Multiple variances
  • Planning Commission unanimously recommended denial

What the facts show

  • Growth was not limited to one large project.
  • Attached housing and higher-density proposals became more visible.
  • Infrastructure and design questions were central to major corridor cases.
  • Planning staff, the Planning Commission, and the BOC sometimes reached different positions.

What this means for residents

Development status matters. A proposed project can change, be tabled, receive conditions, or be denied before construction begins.

What this means for buyers and sellers

Nearby approved or proposed development can influence access, traffic, neighborhood character, convenience, and future buyer perception. Those effects are site-specific possibilities, not guaranteed outcomes.

Important cautions

  • An application is not an approval.
  • A Planning Commission recommendation is not final BOC action.
  • A tabled case remains unresolved.
  • Approval does not establish construction timing.

Sources: Barrow County development applications, planning records, Planning Commission minutes, BOC minutes, regional review documents, and municipal correspondence contained in approved public files.
Page 5 • Taxes, Infrastructure, and Public Investment

Property Values Are Only Part of the Ownership Story

Page 5 connects assessment growth, millage, county budgeting, public-safety spending, water, sewer, and transportation investment.

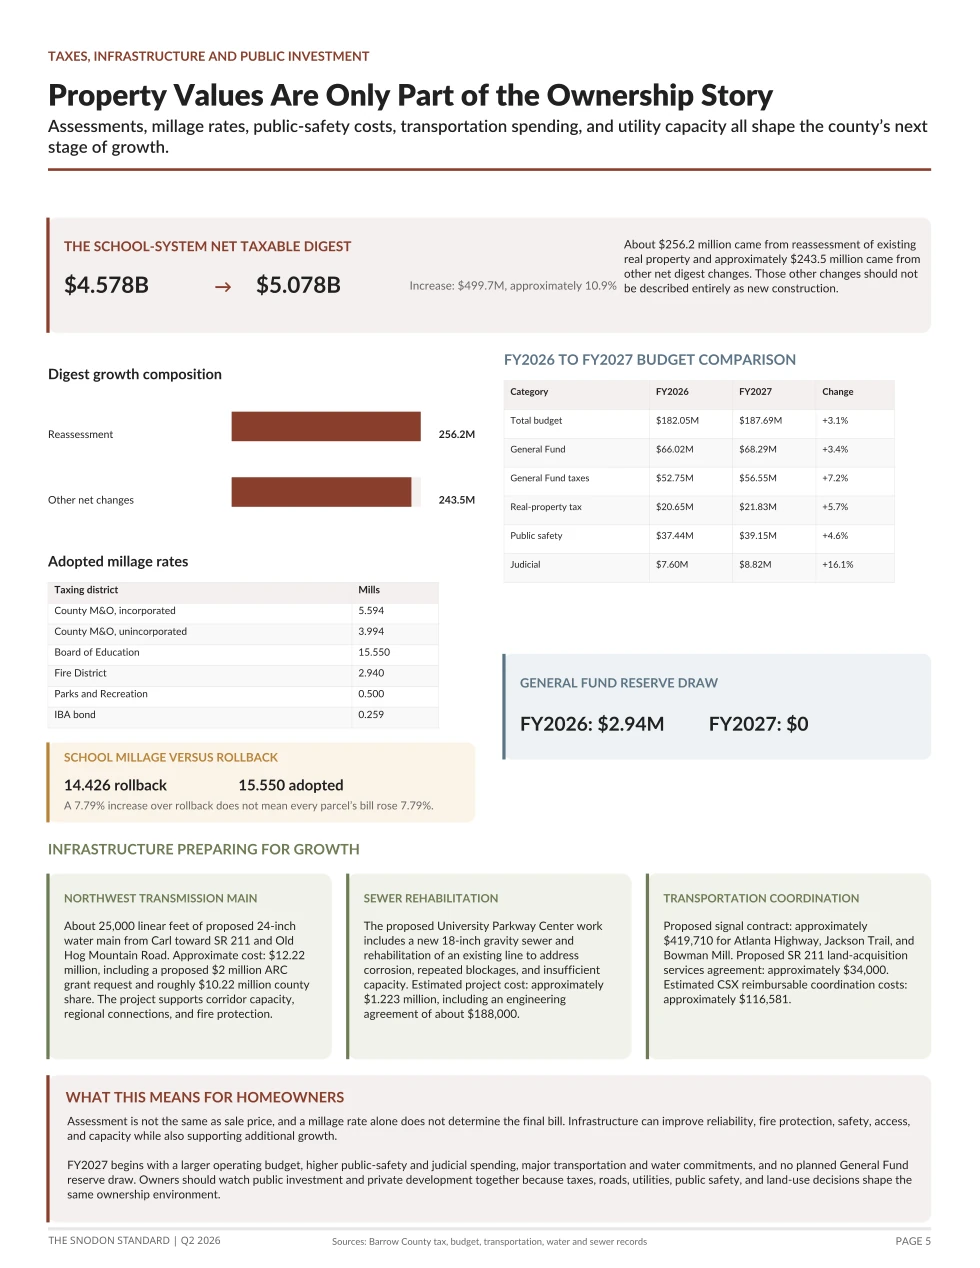
Page 5 of The Snodon Standard Q2 2026, covering taxes, budgets, infrastructure, and public investment.
Original Page 5 from the approved publication.

Taxes and Public Investment

The Barrow County school-system net taxable digest increased from approximately $4.578 billion to $5.078 billion, a gain of about $499.7 million or 10.9%.

Approximately $256.2 million came from reassessment of existing real property, while approximately $243.5 million came from other net changes. Those other changes should not be described entirely as new construction.

$4.578B2025 school-system net taxable digest
$5.078B2026 school-system net taxable digest
10.9%Approximate increase
$187.69MFY2027 approved county budget
$0Planned FY2027 General Fund reserve draw
25,000 ftApproximate proposed northwest transmission-main length
Taxing districtMills
County M&O, incorporated5.594
County M&O, unincorporated3.994
Board of Education15.550
Fire District2.940
Parks and Recreation0.500
IBA bond0.259
CategoryFY2026FY2027Change
Total budget$182.05M$187.69M+3.1%
General Fund$66.02M$68.29M+3.4%
General Fund taxes$52.75M$56.55M+7.2%
Real-property tax$20.65M$21.83M+5.7%
Public safety$37.44M$39.15M+4.6%
Judicial$7.60M$8.82M+16.1%

What the numbers show

  • The taxable base grew rapidly.
  • Reassessment contributed slightly more than half the increase.
  • County operating costs and tax revenue were increasing.
  • Public safety and judicial spending were notable budget pressures.

Infrastructure preparing for growth

  • Proposed northwest transmission main: approximately $12.22 million
  • University Parkway Center sewer estimate: $1.223 million
  • Signal contract: approximately $419,710
  • CSX coordination estimate: approximately $116,581

What this means for homeowners

A tax bill reflects assessment, exemptions, taxing district, millage, and applicable levies. A 7.79% increase over rollback does not mean every homeowner’s bill increased exactly 7.79%.

Important cautions

  • Digest growth is not the same as market-price growth.
  • Millage rates cannot be combined into one universal countywide rate.
  • Proposed infrastructure should not be described as completed.
  • A budget appropriation does not guarantee exact spending.

Sources: Barrow County tax and millage records, FY2027 approved budget, Water Resources and agenda materials, transportation records, and BOC agenda materials.

Page 6 • Methodology and Reader Interpretation

What the Quarter Means for You

The final page translates countywide findings into practical guidance while documenting the report’s scope, definitions, sources, and limits.

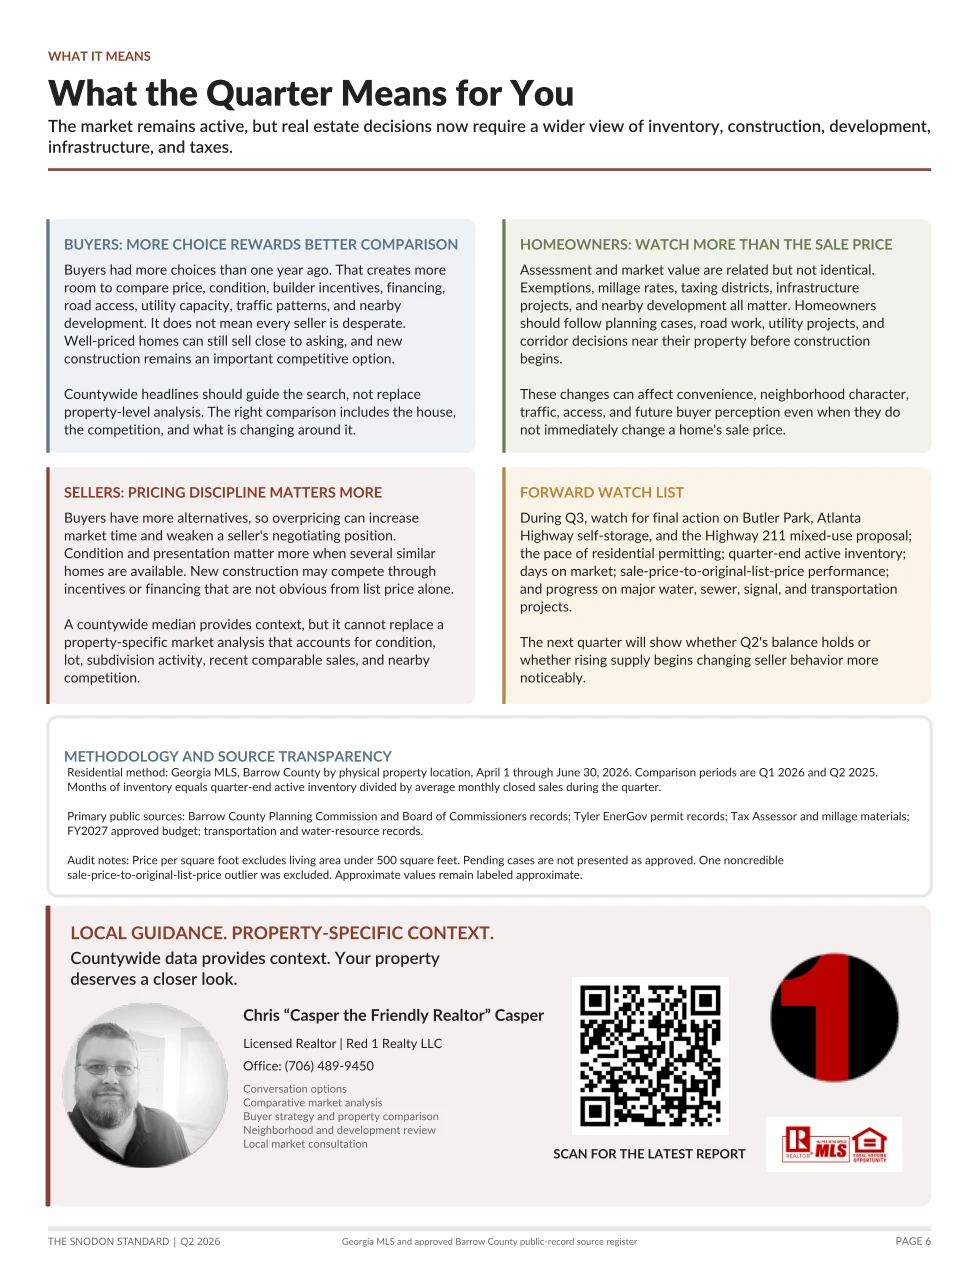
Page 6 of The Snodon Standard Q2 2026, covering buyer, seller, homeowner, methodology, and source guidance.
Original Page 6 from the approved publication.

Applying the Quarter

The Snodon Standard provides countywide context, not a property-specific conclusion. Q2 2026 showed an active but more selective market, rising inventory, substantial builder participation, continued permitting, major development decisions, digest growth, and infrastructure investment.

Buyers

  • Compare resale homes with new construction and builder incentives.
  • Review road access, utility availability, traffic, and nearby development.
  • Use countywide trends as context, not as a substitute for property analysis.

Sellers

  • Price discipline matters when buyers have more alternatives.
  • Condition and presentation matter more in competitive bands.
  • A countywide median cannot replace comparable analysis.

Homeowners

  • Assessment and market value are related but not identical.
  • Nearby development can affect access, convenience, and buyer perception.
  • Planning cases are worth following before construction begins.

Forward watch list

  • Butler Park
  • Atlanta Highway self-storage
  • Highway 211 mixed-use proposal
  • Residential permitting pace
  • Quarter-end inventory and days on market
  • Water, sewer, signal, and transportation projects

Methodology summary

  • Reporting period: April 1-June 30, 2026
  • Comparison periods: Q1 2026 and Q2 2025
  • Geography: Barrow County by physical property location
  • Residential source: Georgia MLS
  • Months of inventory: quarter-end active inventory divided by average monthly closed sales
  • Price per square foot excludes living area below 500 square feet
  • One noncredible SP/original-list-price outlier excluded
  • Pending projects are not presented as approved

What this report does not claim

  • It does not predict future market performance.
  • It does not replace an appraisal or comparative market analysis.
  • It does not provide tax, legal, engineering, or inspection advice.
  • It does not assume countywide findings apply equally to every property.

Source standard: Georgia MLS for residential activity; approved Barrow County public records for permits, planning, zoning, budgets, taxes, water, sewer, and transportation; applicant details remain labeled as applicant-provided; pending items remain identified as pending.

Issue questions

How to read the report

Did Barrow County home prices fall in Q2 2026?

The median sale price softened modestly compared with Q2 2025, while the average sale price remained essentially unchanged and median price per square foot increased slightly. The report does not characterize the quarter as a broad market collapse.

Was Q2 2026 a buyer's market?

Buyers had more choices and more time to compare alternatives, but sellers still received more than 97% of original list price on average. Countywide conditions were more balanced and selective, not uniformly buyer-dominated.

What does 4.58 months of inventory mean?

It is a calculated indicator based on quarter-end active inventory divided by the quarter's average monthly closed sales. It describes current supply relative to the recent sales pace; it is not a forecast.

Does a residential building permit mean a home will be listed soon?

No. A permit indicates approved building activity, not completion, occupancy, or future MLS availability.

Why did the taxable digest increase?

The digest increase included both reassessment of existing real property and other net changes. It should not be described entirely as new construction, and it does not mean every parcel rose by the same percentage.

Complete guided edition

Countywide data provides context. Your property deserves a closer look.

The full six-page guided issue is now available online. For property-specific guidance, request a conversation about market value, buyer strategy, neighborhood context, or nearby development.